Facette 101
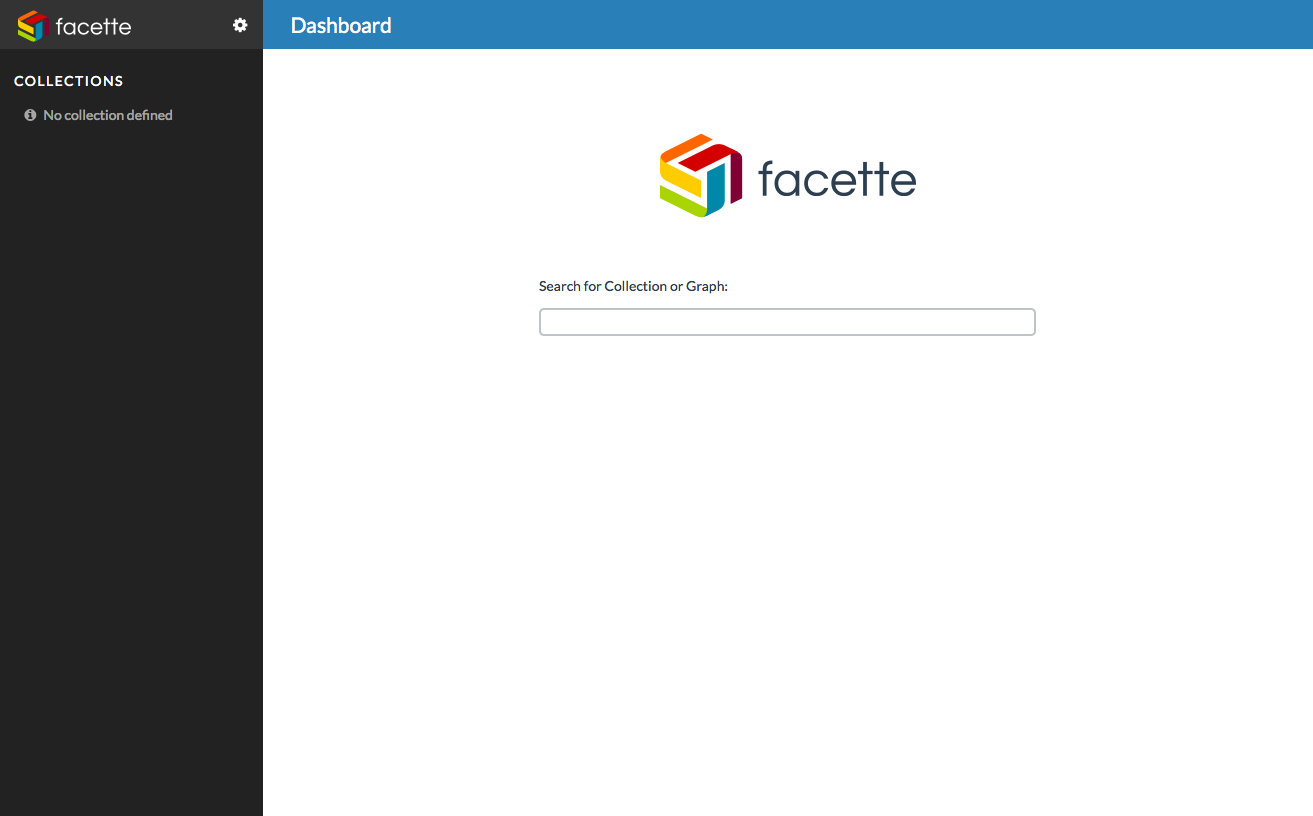
3 minYou’ve decided to give Facette a try with your metrics, good for you! After installing the latest version, open your browser and point it to the address it is listening on — that would be http://localhost:12003 if using the default settings — and *BAM!*, here you are:
Nothing much to be seen so far, let’s do something about it: get to the
choppa administration panel by clicking on the cog-shaped icon next to the
logo in the upper left corner:
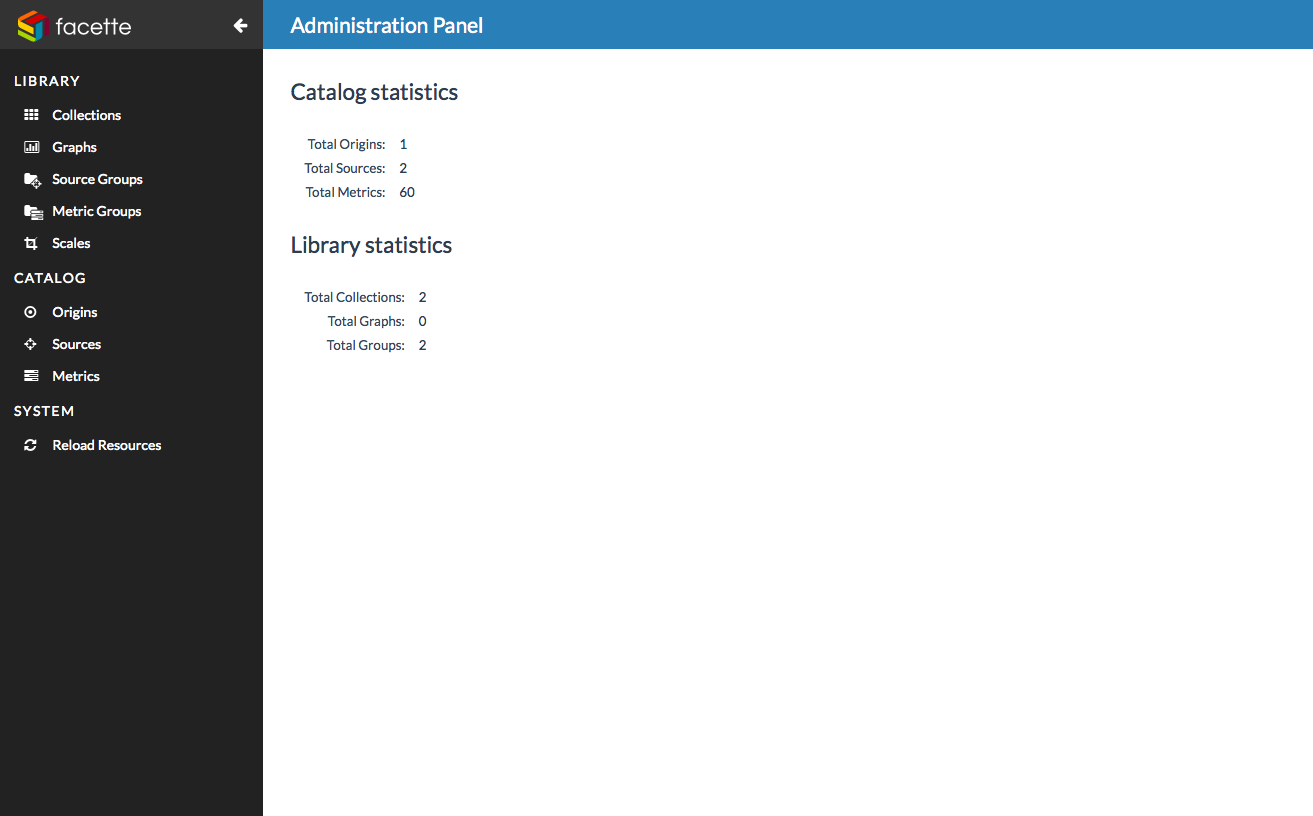
We’re going to create our very first graph by heading to the Graphs section of the library in the navigation bar on the left side of the screen. From there, click on the + (plus) sign next to the section title to create a graph.
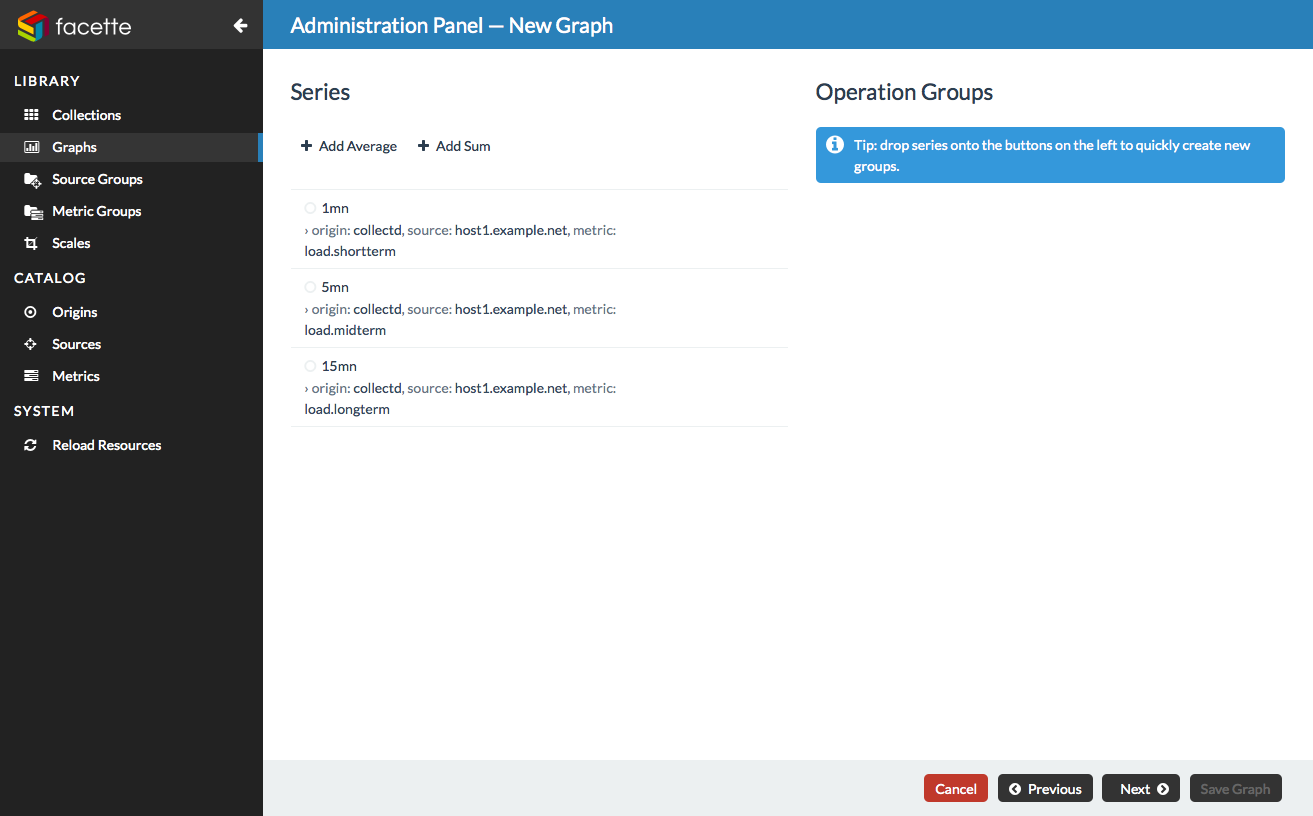
Our first graph will feature 3 series of metrics from the host host1.example.net, acquired through the provider “collectd”: load.shortterm, load.midterm and load.longterm.
Note: when focusing a field, type a ? (question mark) sign to show the auto-completion:
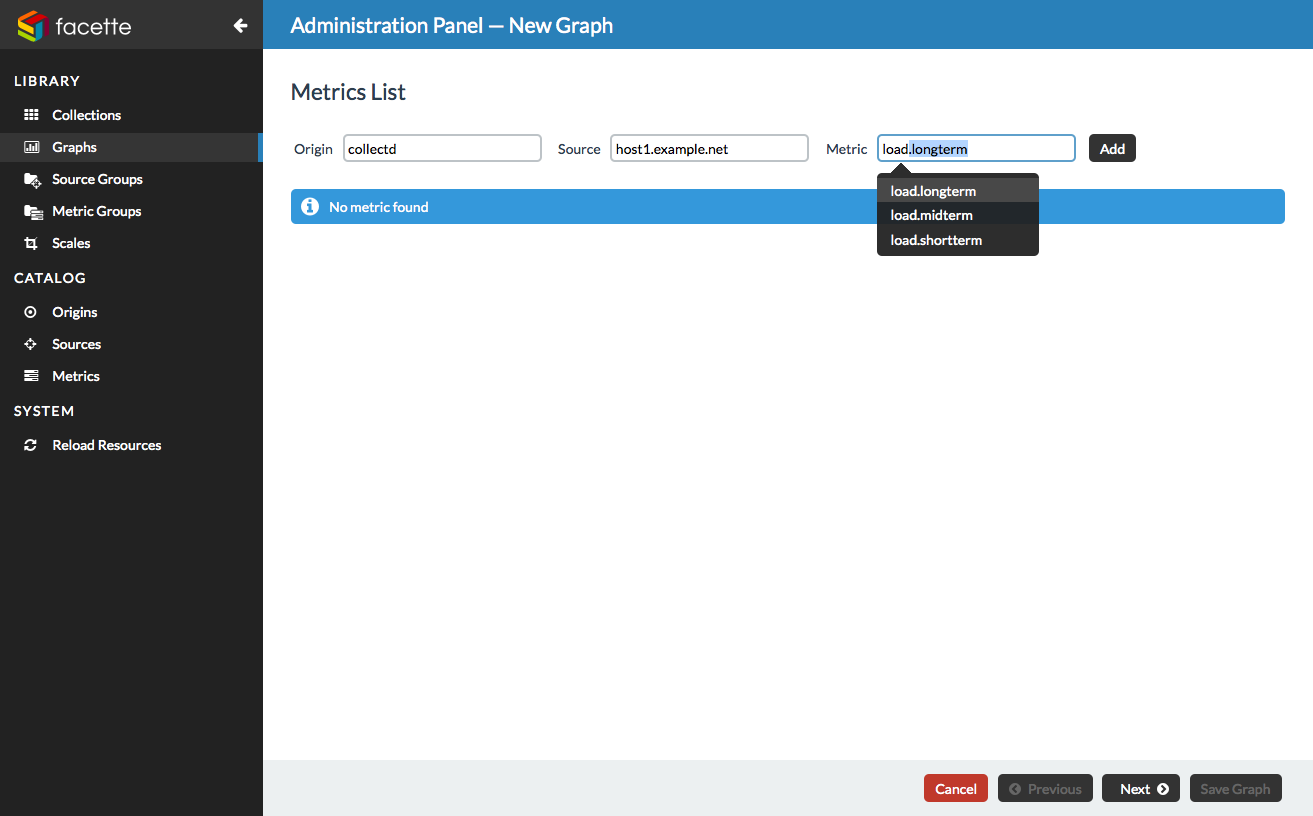
Now that we’ve added the 3 series to the metrics list, we move on the the next step by clicking on the Next button.
This step allows us to set up how the series are handled: among other things, we can rename them, assign them a custom color or re-order the list. For the exercise, we will rename the series serie0, serie1 and serie2 into 1mn, 5mn and 15mn. To rename a series, click on the pen-shaped icon next to its name:
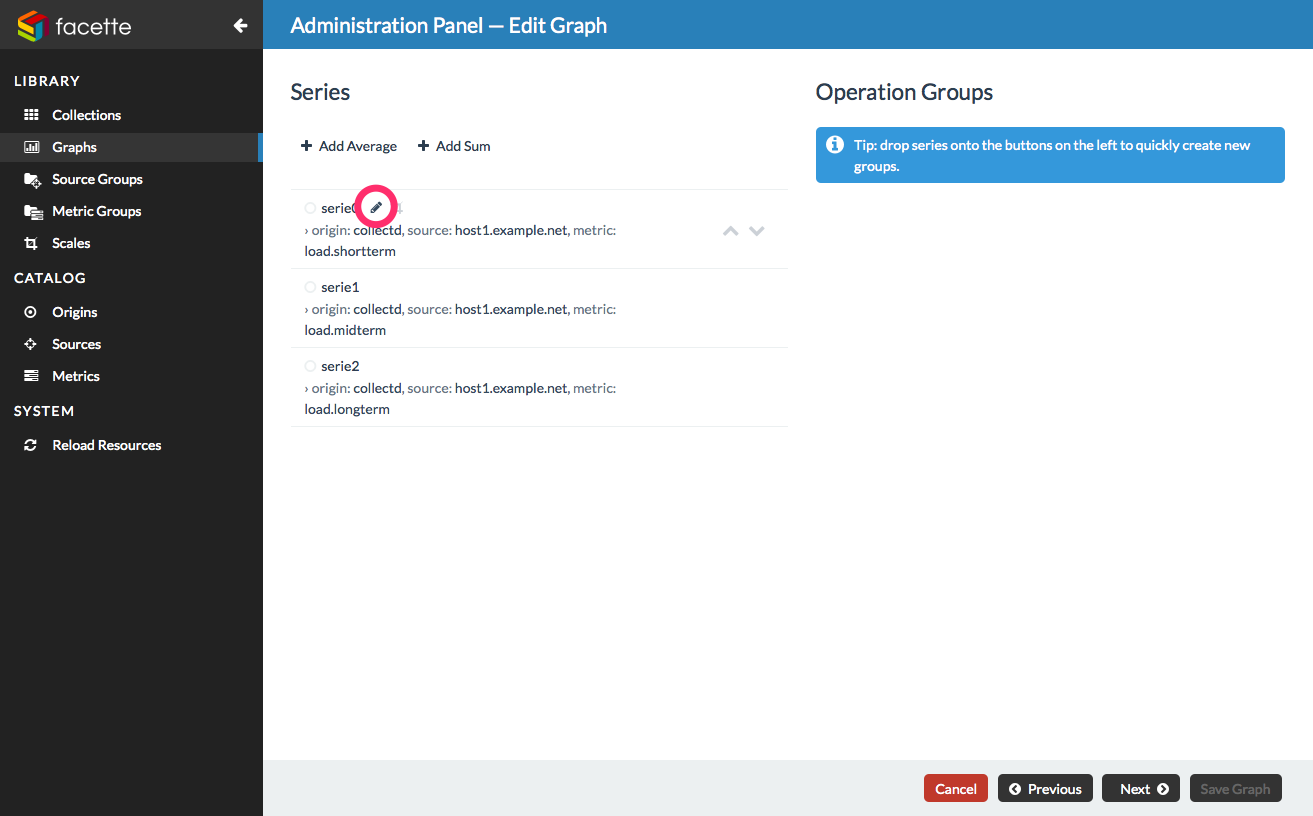
Once our series are renamed, we click on the Next button to move on to the final step of the graph creation:
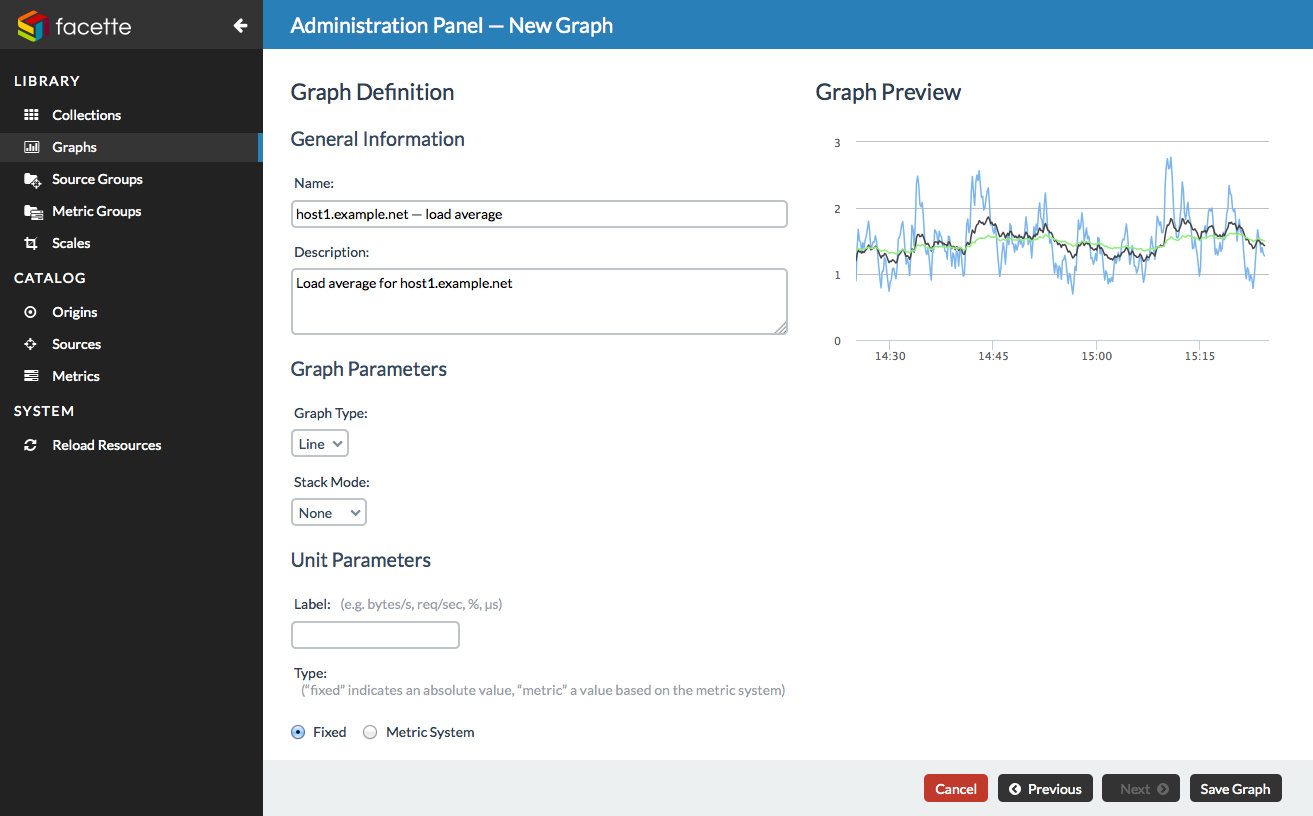
The last step gives us a live preview of our graph, and we have to give it a name. We can also tweak some of the graph properties, such as the style of the plots (line or area-shaped), add a description or set labels for the Y-axis. Let’s add a description and choose to represent our plots as lines:
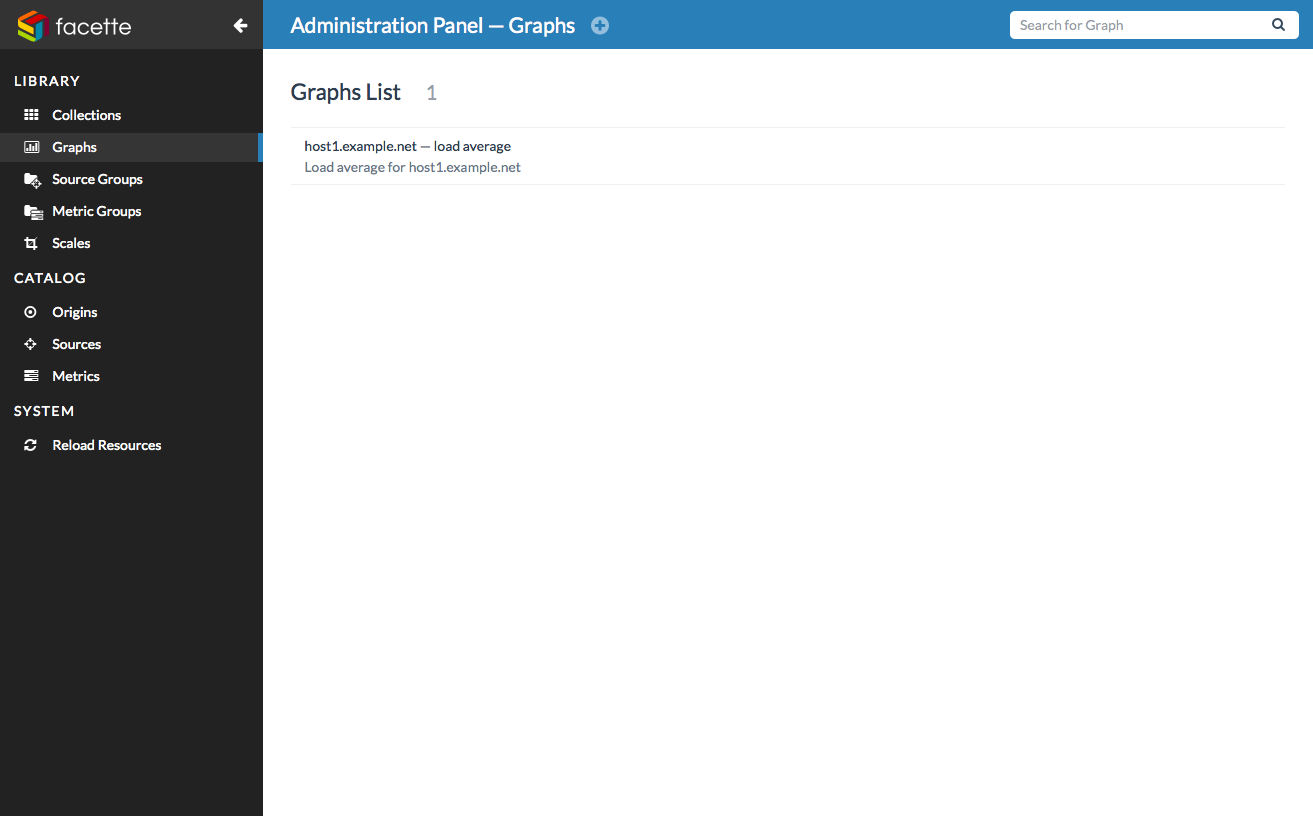
Finally, after saving your graph you will find it showing up in the graphs list:
Getting back to the “public” side of Facette by clicking on the arrow-shaped icon next to the logo in the upper left corner, we access our newly created graph by typing “load” in the homepage search field:
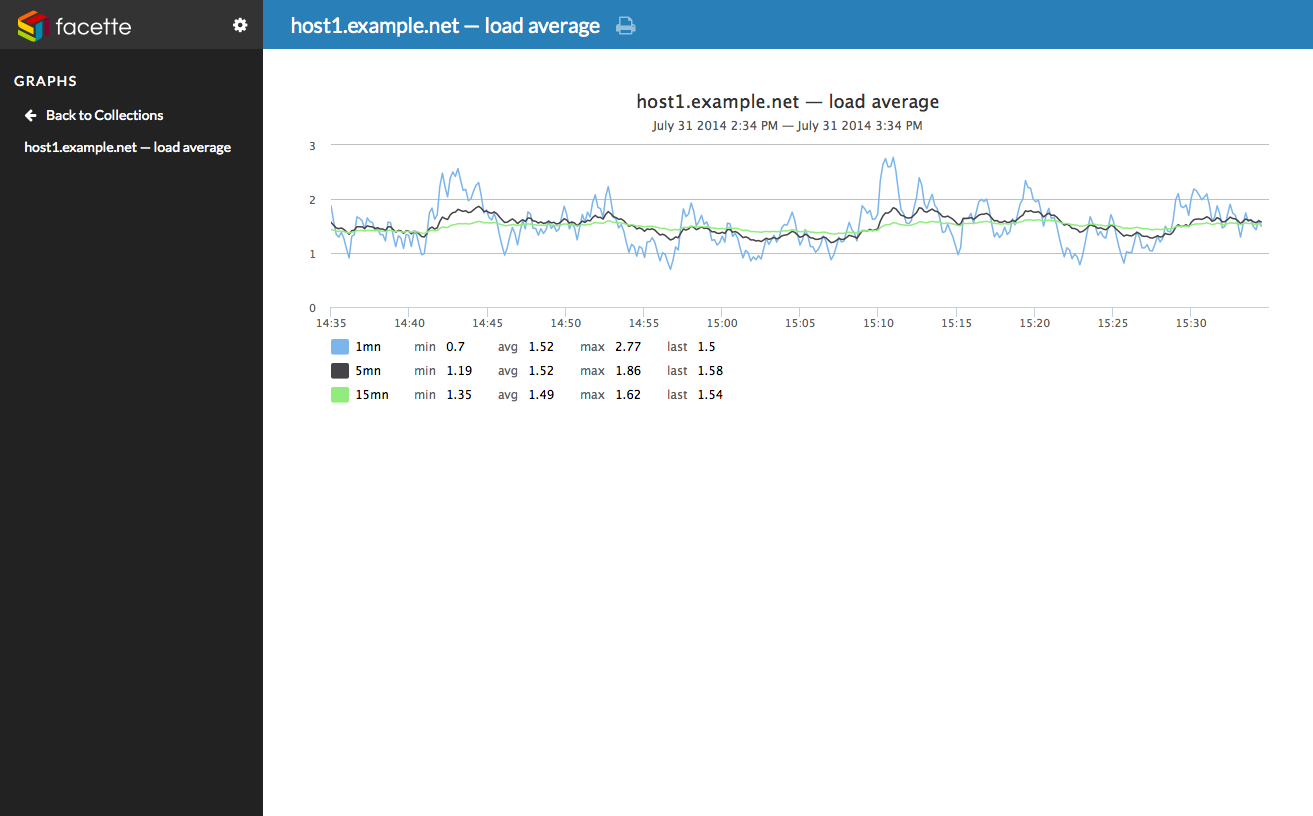
That was easy, wasn’t it? ;-)

Let’s take this a step further, introducting collections. Collections allow you to group graphs on a same page, for instance graphs relating to the same host.
Using the same method described earlier, I created a second graph titled
“host1.example.net — network traffic” featuring host1.example.net’s eth0
network interface inbound and outbound traffic.
To create a new collection, head to the collection section in the administration panel and click on the + (plus) sign next to the section title. Then, start typing the title of the graphs you want to add to the collection — the auto-completion will help you and click on the Add button to add them to the graphs list:
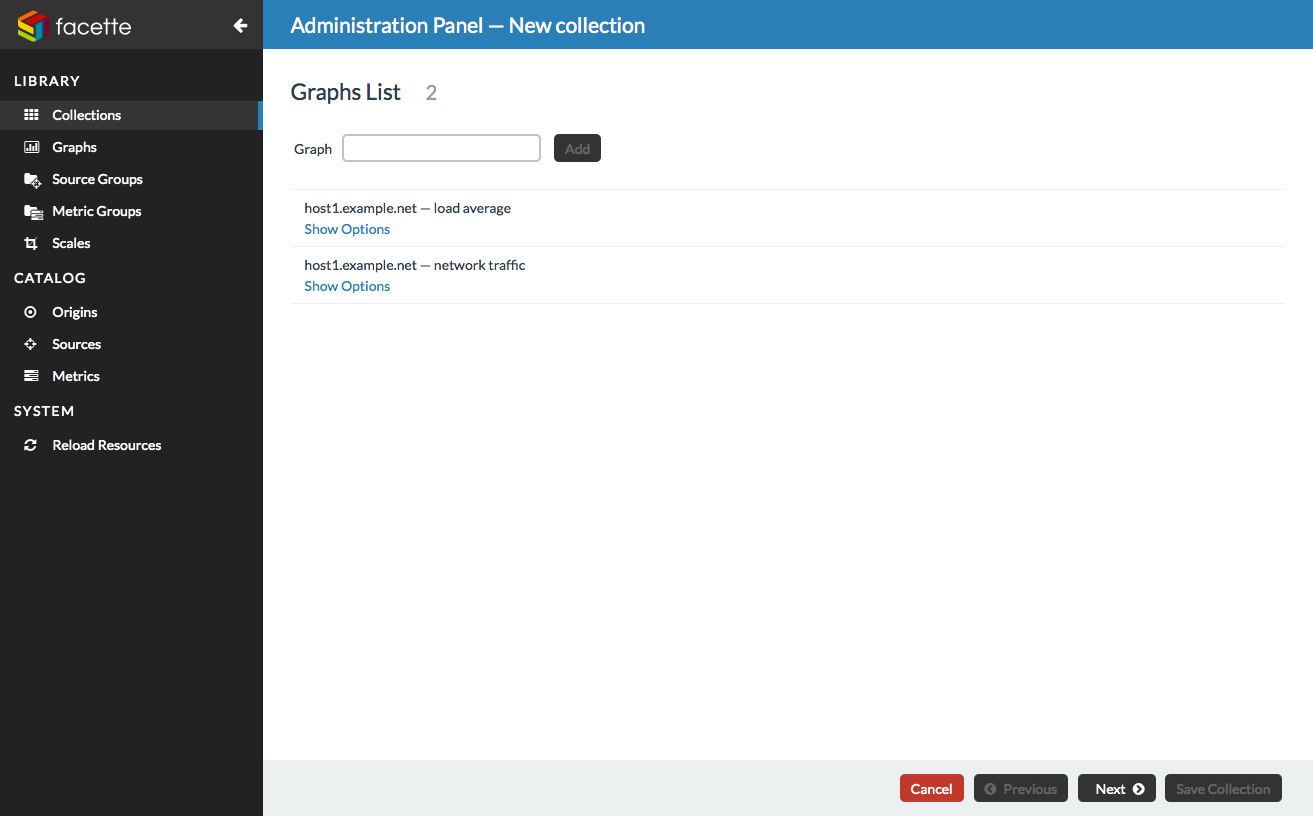
Once you’re done, move on to the next step and finalize the collection creation by giving it a name — let’s say “host1.example.net” — and save it.
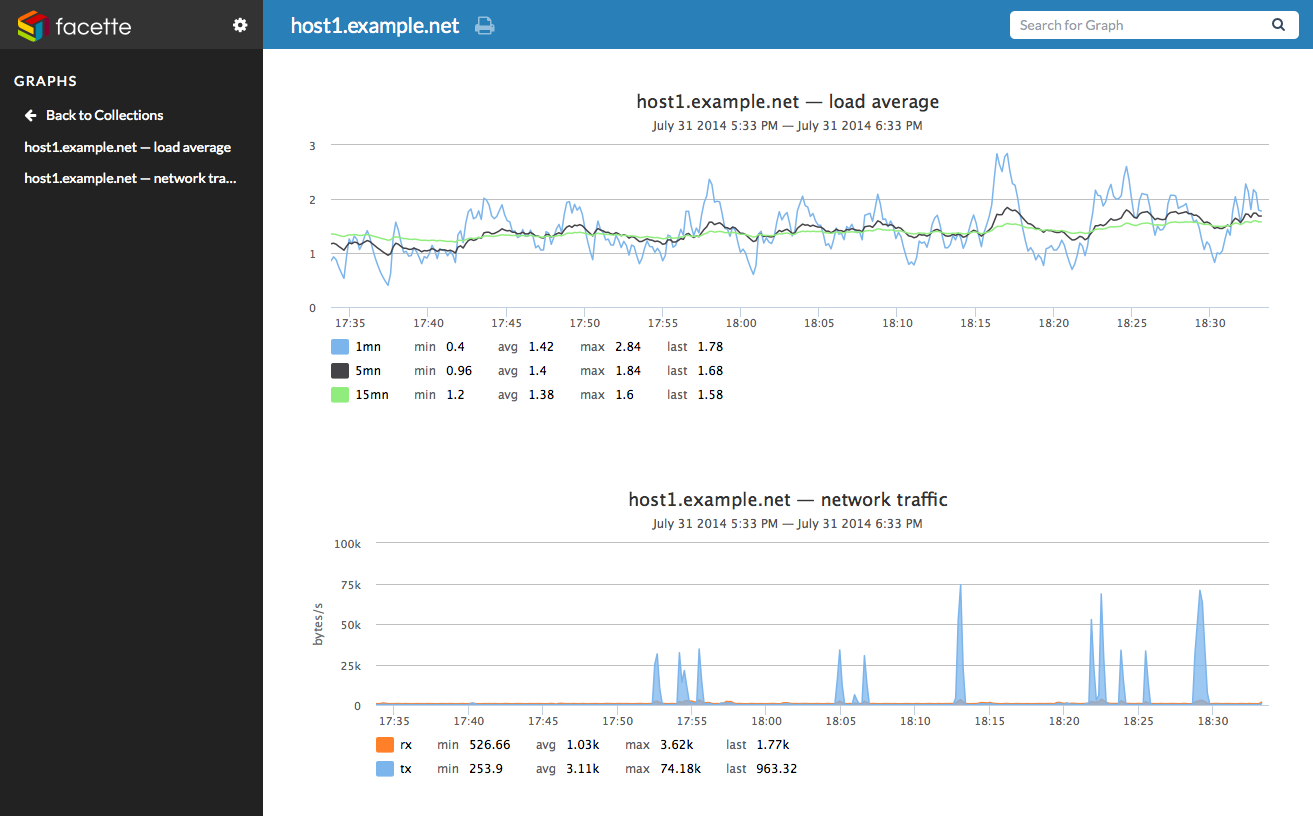
Back to the public side, you can now see our collection appear in the list on the left: click on it to browse it.
Stay tuned for more articles diving into the details and features of Facette!