Dive into Facette: graph templates
3 minGraph templates have been introduced in the 0.3.0rc1 version of Facette.
Instead of the somewhat tedious process of manually creating/cloning similar graphs for a possibly large number of sources and metrics, templates allow you to create a graph “model” once that can then be instanciated as many times you want to create graphs by only specifying the attributes needed. By extension, any change made to a template is automatically applied to all graphs instanciating this template. No more having to edit all your graphs because of a slight change in a description or an axis label!
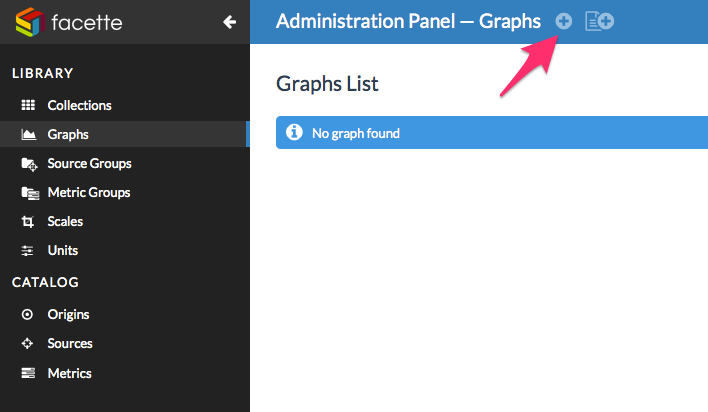
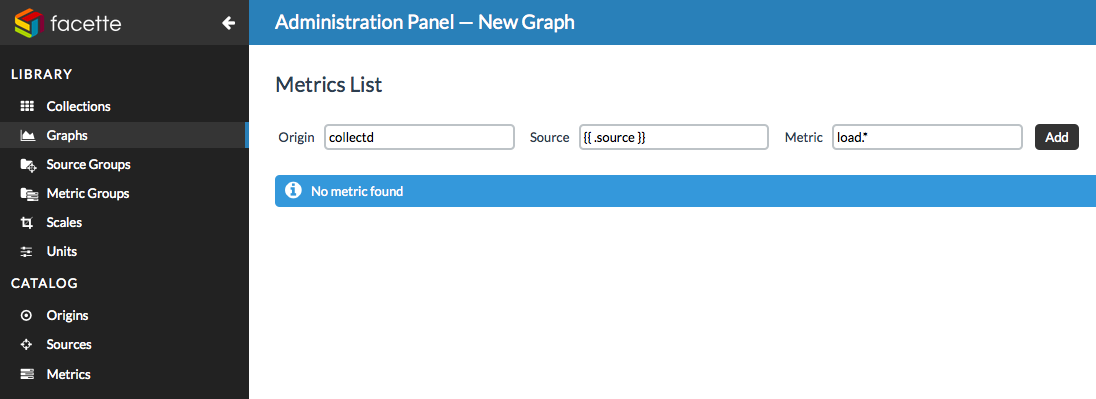
Head to the Graphs library section of the administration. You’ll notice that there are now 2 buttons in the header: the first one to create “plain” graphs (the ones you used to create so far) but now also graph templates, and a second new one to create linked graphs – which are graphs instanciating a template. Let’s first create a graph template, which begins the same way as for creating a traditional graph.
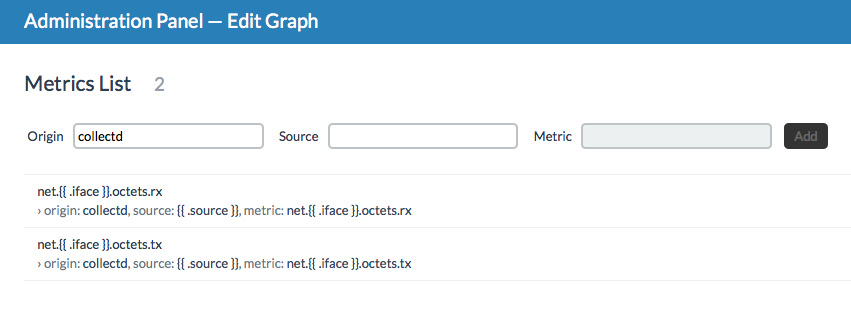
Once in the metrics list page, we type in the Source field a templating
tag – enclosed in double braces symbol, {{ .<attribute name> }} –
referencing a .source attribute: this is arbitrary, the attribute can be
named as you wish (e.g. .server or .host) – but it has to be prefixed with
a dot. Next, select a metric or a metric group in the Metric field and add
the metric to the list, then move on the final step of the graph creation
process.
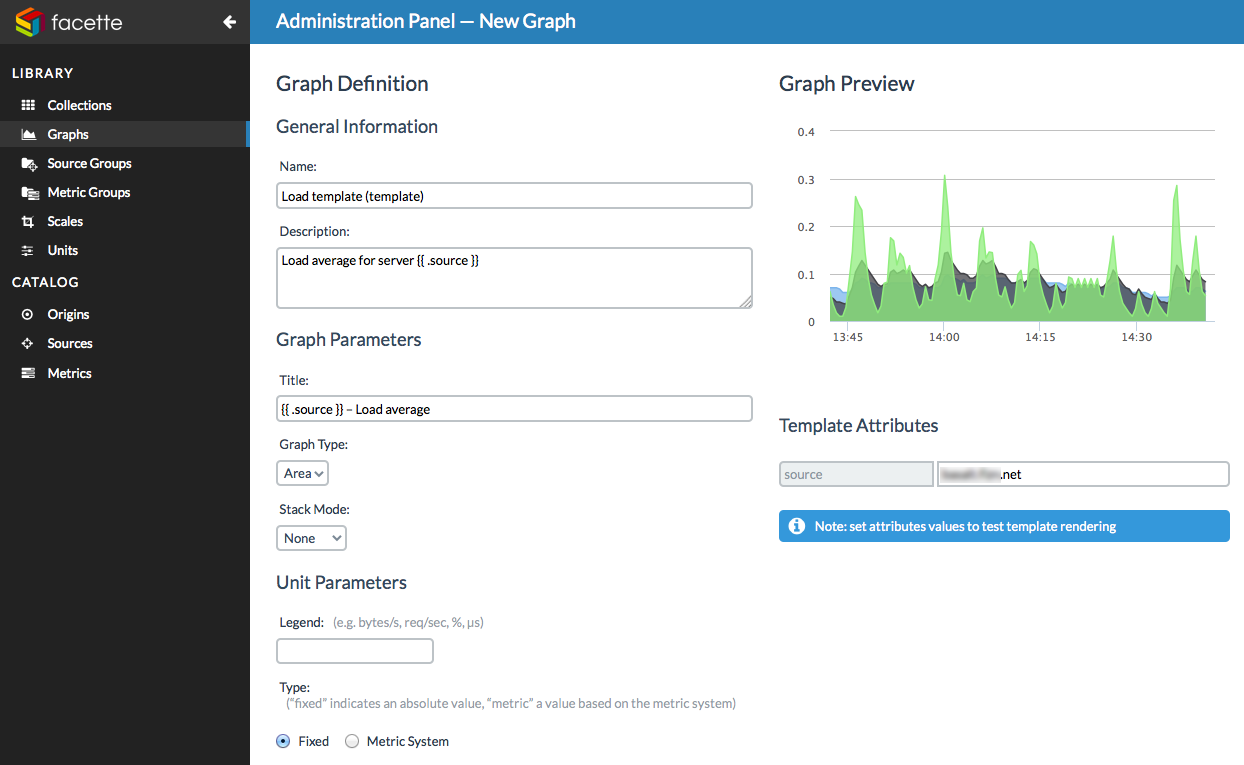
As the web interface detects the presence of templating tags in one of the previous fields it adds a new Template attributes section under the graph preview: you can test the rendering of your graph by entering values that will be used where you entered the attributes in the metrics list. Note: this is optional, the values you enter here are for testing only and will not be registered as attributes.
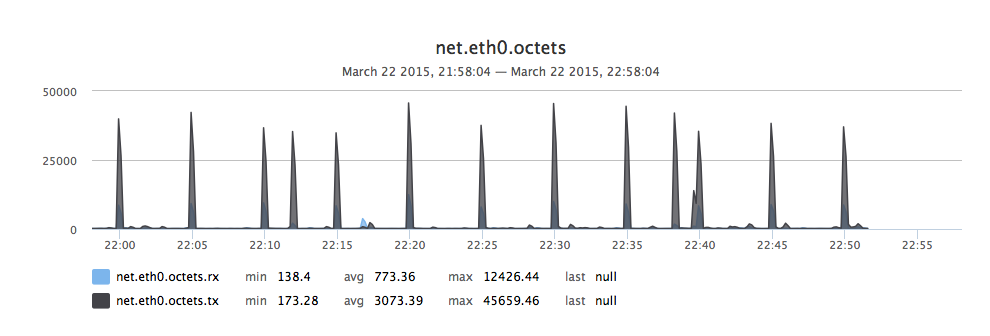
For example, when I set the source template attribute to match an existing source the graph preview is triggered:
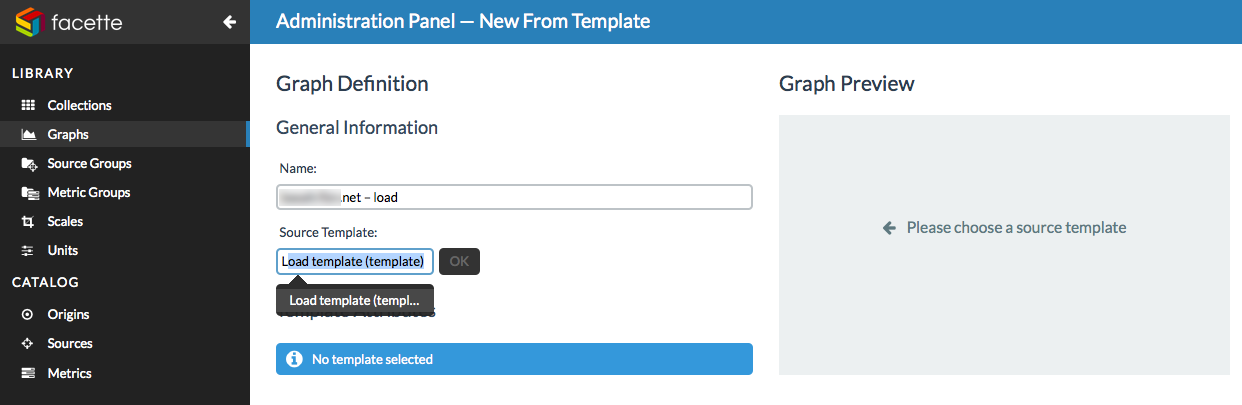
Complete the graph template creation by clicking on the Save template button when you’re set. Once you’re done, you’ll see the graph template you just created in the graph templates list. To create a graph that uses this template, click on the second button “Add From Template” in the header.
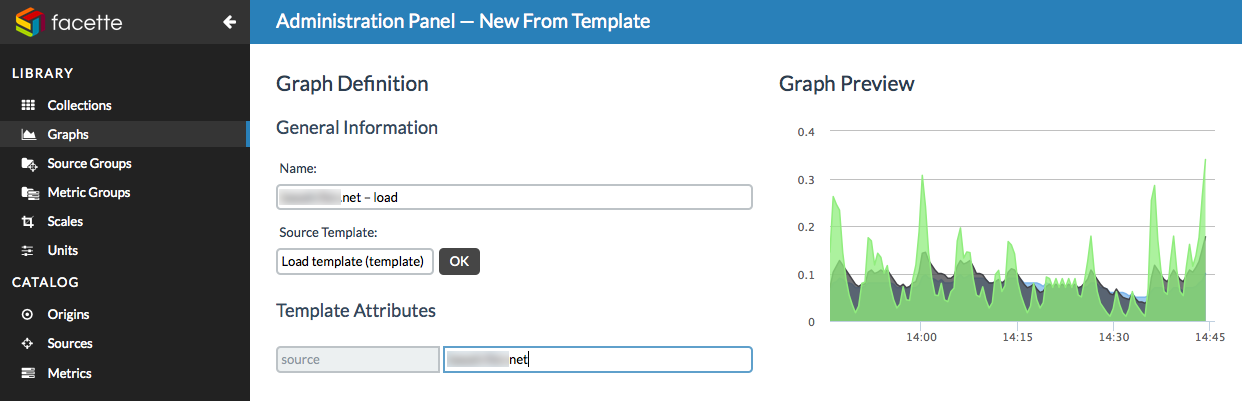
The process of creating a graph from a template is much more concise: enter a unique name for the graph, then select the template to use by starting to type its name in the Source Template field and finally set values for the template attributes you’ve declared when creating the template.
To confirm everything works as expected, the graph preview is triggered when existing values are entered:
Once you’re done, you can save the graph. You’ll notice back in the graphs list that the graph you just created has its “templated” fields rendered:
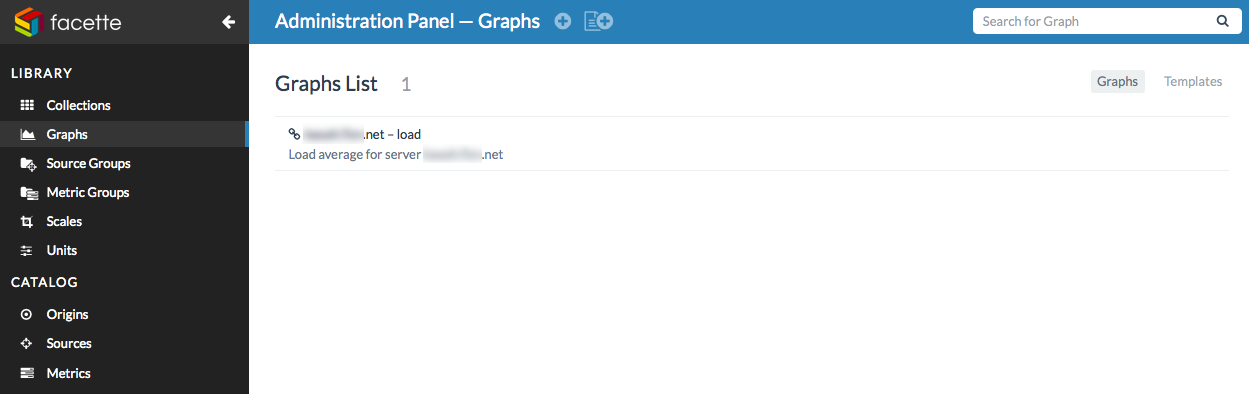
You can then display the full graph by clicking on the arrow-shaped icon “Go to graph”:
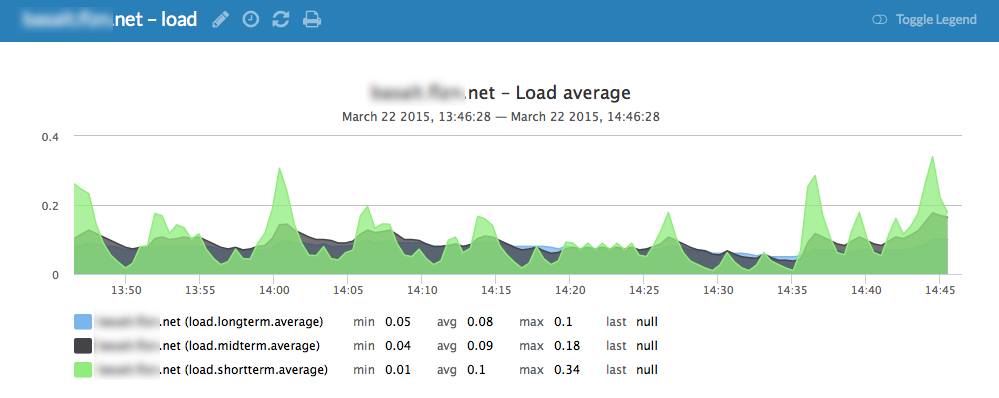
Pretty simple, huh?
The fields that can serve as templates are:
- series origin
- series source
- series metric
- graph description
- graph title
You can of course add multiple template tags and template attributes per graph: